
Revealing response pattern of anthropogenic volatile organic compound emissions to urbanization in Asia
As one of the most severe environmental issues apace with urbanization, air pollution poses significant threats to public health and the ecosystem in populous Asia. Emissions of air pollutants and their precursors respond differently to urbanization. For example, the response of SO2 to urbanization (indicated by per-capita income) is an inverted U-shaped pattern. At the same time, PM2.5 responds to urbanization (indicated by time) linearly, yet neither has been found with clear drivers. The pattern for anthropogenic non-methane volatile organic compounds remains unclear in Asia, primarily due to uncertainties in the bottom-up estimations of NMVOC emissions.
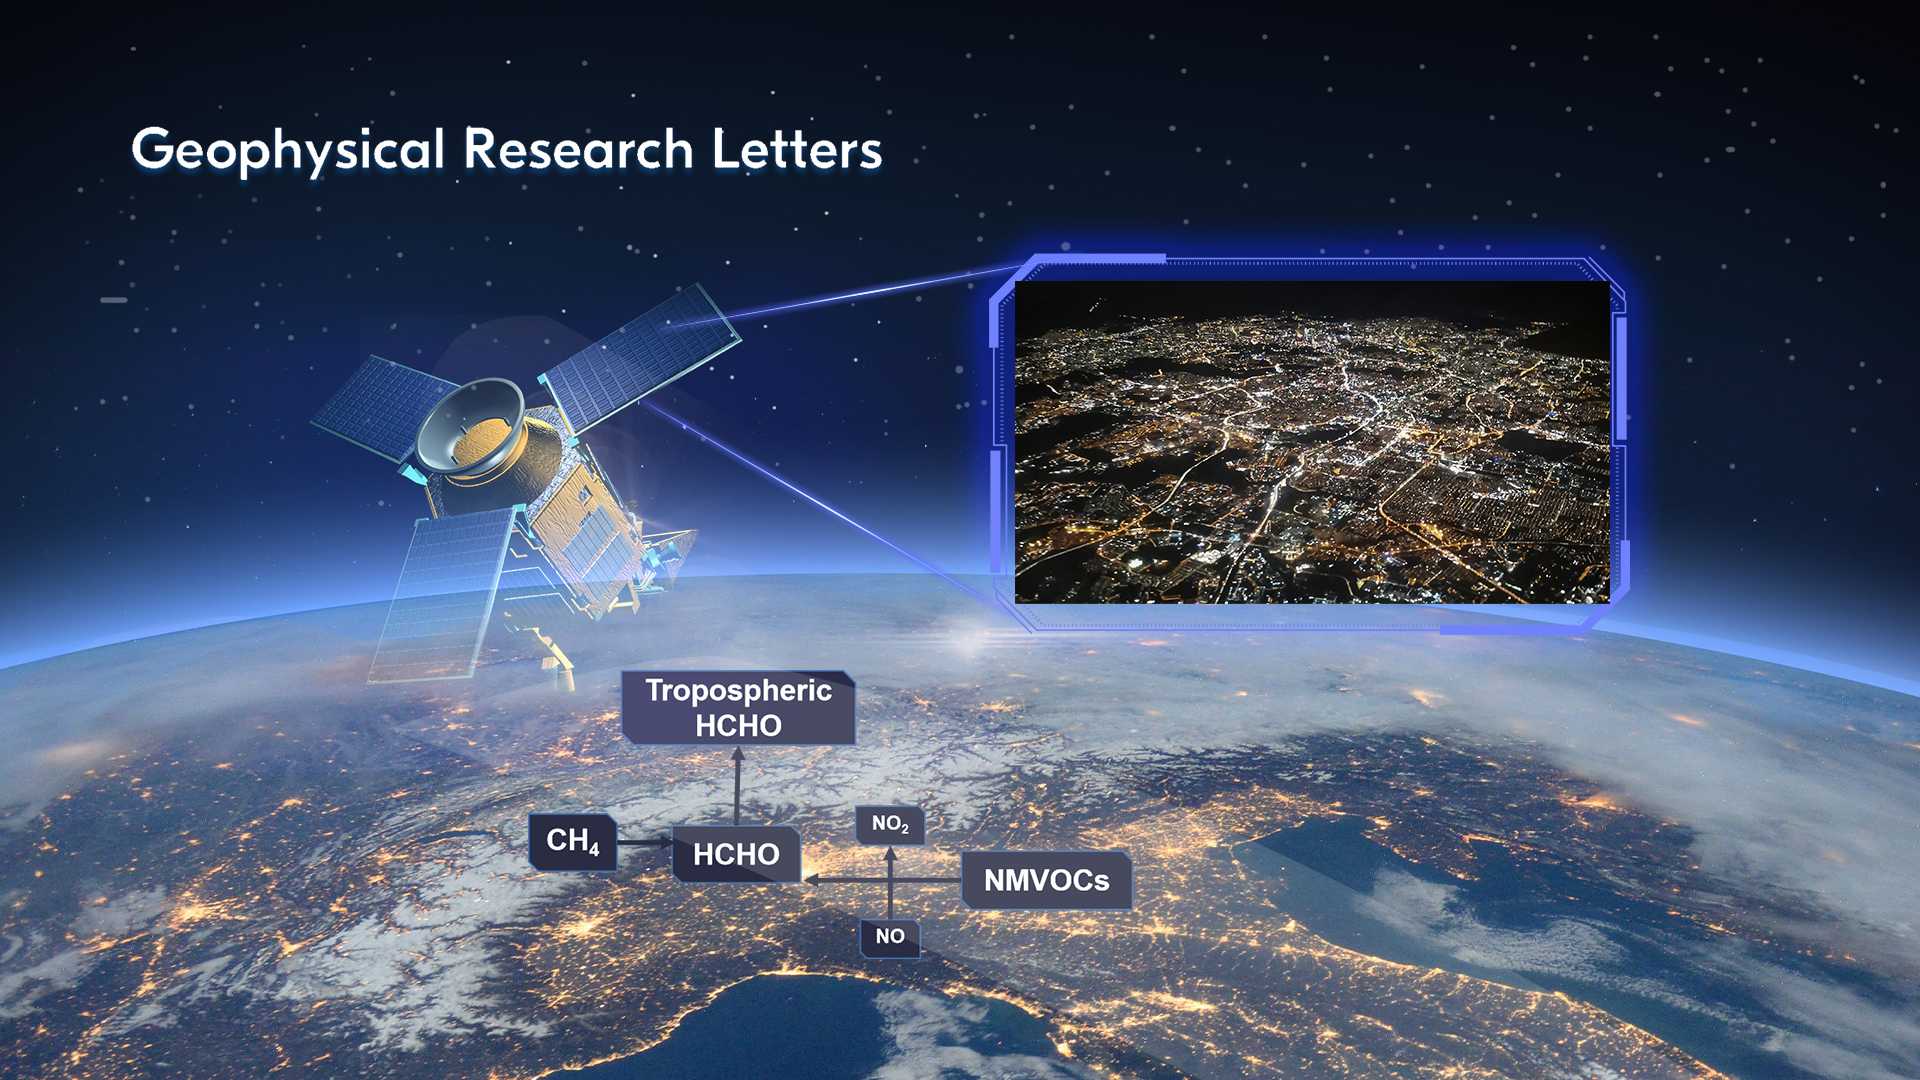
Assistant Professor Lei Zhu’s group from the School of Environmental Science and Engineering (ESE) at the Southern University of Science and Technology (SUSTech) has recently used formaldehyde (HCHO) columns from the newly launched TROPOspheric Monitoring Instrument (TROPOMI) satellite as a proxy of NMVOC emissions. Together with the Visible Infrared Imaging Radiometer Suite (VIIRS) night-time light (NTL) data and population density data as measures of urbanization, they explore how anthropogenic NMVOC emissions evolve with urbanization across Asian countries.
Their paper, entitled “Response of Anthropogenic Volatile Organic Compound Emissions to Urbanization in Asia Probed with TROPOMI and VIIRS Satellite Observations,” was published in Geophysical Research Letters (GRL), a top journal in the field of geosciences.
The study uses the HCHO column concentration of TROPOMI as the tracer emissions of NMVOC and the NTL data and population density data of VIIRS as the parameters to characterize urbanization to explore the response pattern of anthropogenic NMVOC emissions to Asian urbanization. In order to exclude the influence of natural source VOC and NOx on the response model, they used the NASA meteorological reanalysis data (MERRA-2), global fire emissions data (GFED 4), emission inventory data (EDGAR), and the atmospheric chemical model (GEOS-Chem).
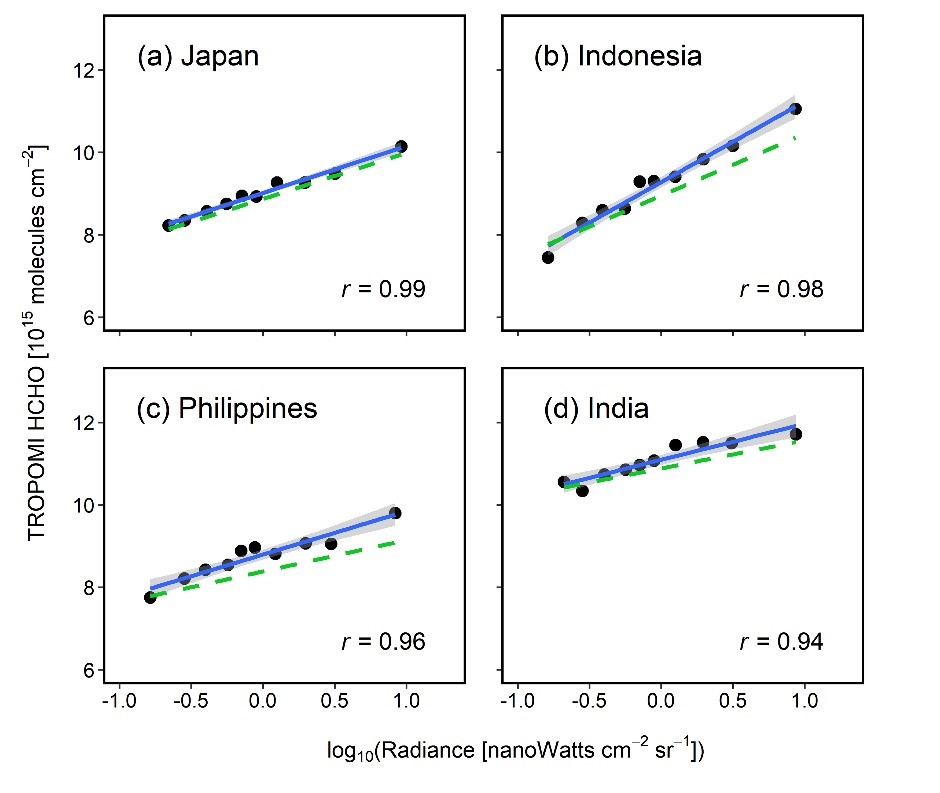
Figure 1. The relationship between HCHO columns and VIIRS NTL radiance
In Fig. 1(a-d), it indicates Japan, Indonesia, the Philippines, and India, respectively. In each panel, a point represents the mean HCHO columns at a specific NTL radiance bin for all urban grid cells within that country. The blue line shows the simple linear regression line, with a gray area enveloping the 95% confidence interval of the mean response. Pearson correlation coefficients (r) are also inserted. The green dashed line represents the simple linear regression line after excluding the impact of spatial variations of NOx emissions on HCHO columns.
The results shown in Fig. 1 indicate that there was a significant positive correlation between HCHO column concentration and NTL in Japan, Indonesia, the Philippines, and India (the four countries with the highest correlation coefficients). The researchers found significant linear relationships in 19 of the 24 Asian countries, with correlation coefficients (r) ranging from 0.64 to 0.99. Likewise, HCHO column concentrations were closely related to population densities in major Asian countries (0.70 ≤ r ≤ 0.99). In addition, the effect of NOx on the response pattern was quantified based on the results of 5 GEOS-Chem sensitivity simulation experiments (Fig. 2) and TROPOMI NO2 data. It was found that the effect of spatial differences in NOx emissions on HCHO column concentration was slight.
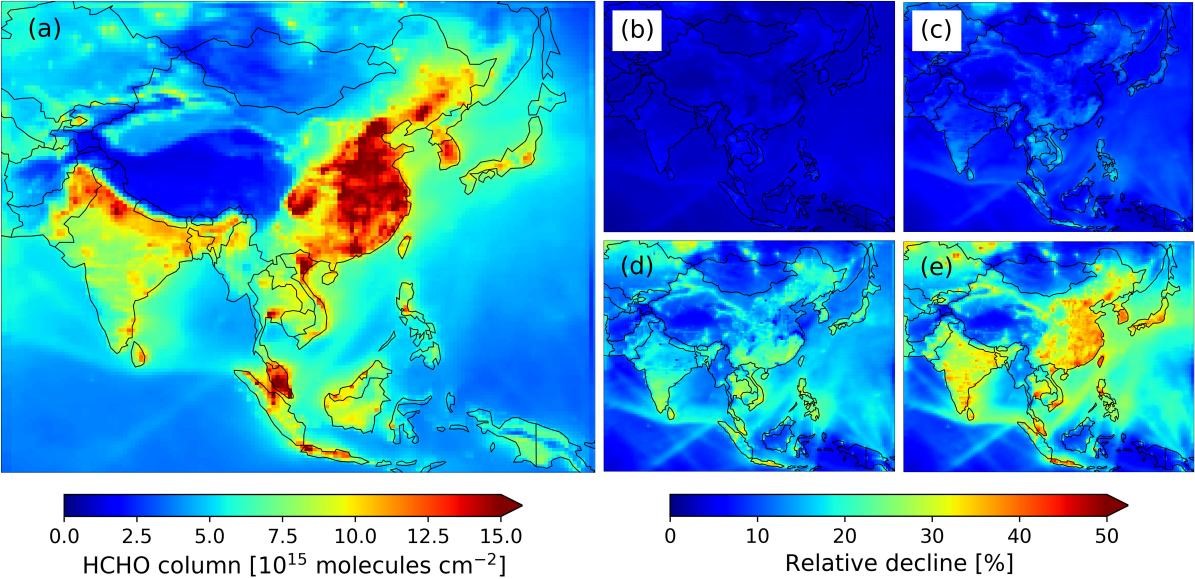
Figure 2. GEOS-Chem sensitivity simulation results
Prof. Zhu’s team analyzed the relationship between the national average HCHO column concentration, NTL, and population density (Fig. 3). The results showed that the linear relationship between HCHO column concentration and NTL is weaker than that between population density, suggesting that population density may be an overall indicator of NMVOC emissions from the industrial, ground transportation and residential sectors. At the same time, NTL is more related to electricity consumption. Nevertheless, satellite NTL data has the advantages of real-time update, large scanning range, and fast response speed, and it still has great potential to characterize urbanization.
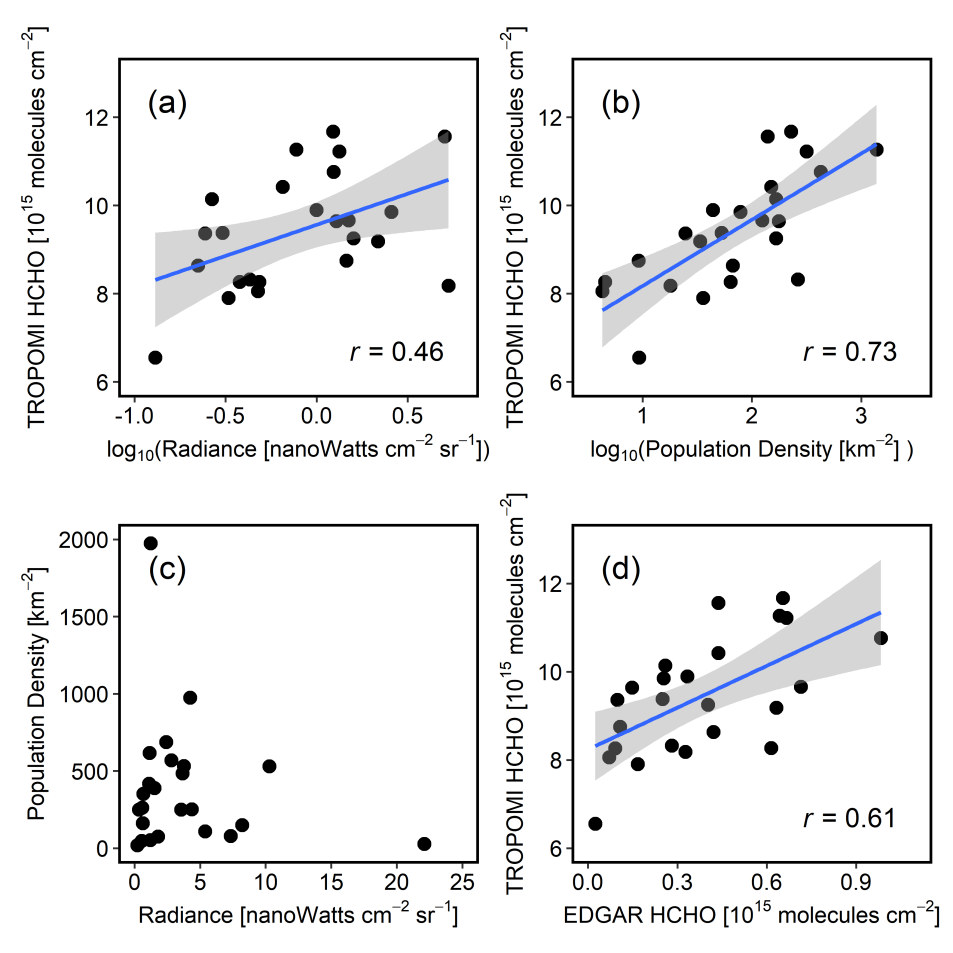
Figure 3. The response of HCHO columns to NTL radiance (a) and population density (b), the relationship between NTL radiance and population density (c), and TROPOMI and EDGAR-based HCHO columns (d).
The researchers used TROPOMI, VIIRS satellite observations, and population density data to explore how anthropogenic non-methane volatile organic compound (NMVOC) emissions evolve with urbanization in Asia, and find HCHO columns (an indicator of anthropogenic NMVOC emissions) correlate moderately to highly (0.64 ≤ r ≤ 0.99) with night-time light (NTL) radiance (an indicator of urbanization) within major Asian countries. TROPOMI HCHO column is confirmed as a reliable proxy of anthropogenic NMVOC emissions in Asia. This study suggests a current linear response between anthropogenic NMVOC emissions and urbanization in Asia, with no apparent turnover yet.
Dongchuan Pu, a Ph.D. student in Asst. Prof. Lei Zhu’s research group, is the first author of this paper. Prof. Lei Zhu is the corresponding author, while other co-authors include Dr. Isabelle De Smedt of the Royal Belgian Institute for Space Aeronomy (BIRA-IASB), and Profs. Xin Yang and Tzung-May Fu from the School of ESE at SUSTech.
SUSTech is the communication unit of this paper, and the Harbin Institute of Technology (HIT) is the first corresponding unit. The authors of this study also acknowledge the support from the Center for Computational Science and Engineering (CCSE) at SUSTech.
This work was funded by the Key-Area Research and Development Program of Guangdong Province, Guangdong Basic and Applied Basic Research Foundation, Guangdong University Research Project Science Team, Guangdong Basic and Applied Basic Research Fund Committee, Guangdong University Youth Innovation Talent Project, and Shenzhen Science and Technology Program.
Paper link: https://agupubs.onlinelibrary.wiley.com/doi/10.1029/2022GL099470